html5生成柱狀圖(條形圖)效果的實例代碼
編輯:HTML5教程
- <html>
- <canvas id="a_canvas" width="1000" height="700"></canvas>
- <script>
- (function (){
- window.addEventListener("load", function(){
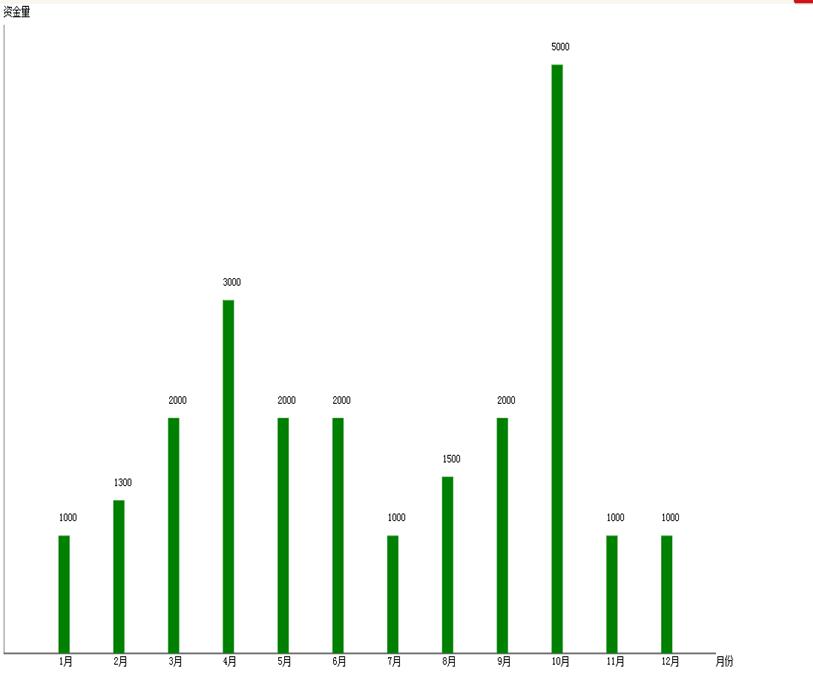
- var data = [1000,1300,2000,3000,2000,2000,1000,1500,2000,5000,1000,1000];
- var xinforma = ['1月','2月','3月','4月','5月','6月','7月','8月','9月','10月','11月','12月'];
- // 獲取上下文
- var a_canvas = document.getElementById('a_canvas');
- var context = a_canvas.getContext("2d");
- // 繪制背景
- var gradient = context.createLinearGradient(0,0,0,300);
- // gradient.addColorStop(0,"#e0e0e0");
- //gradient.addColorStop(1,"#ffffff");
- context.fillStyle = gradient;
- context.fillRect(0,0,a_canvas.width,a_canvas.height);
- var realheight = a_canvas.height-15;
- var realwidth = a_canvas.width-40;
- // 描繪邊框
- var grid_cols = data.length + 1;
- var grid_rows = 4;
- var cell_height = realheight / grid_rows;
- var cell_width = realwidth / grid_cols;
- context.lineWidth = 1;
- context.strokeStyle = "#a0a0a0";
- // 結束邊框描繪
- context.beginPath();
- // 准備畫橫線
- /*for(var row = 1; row <= grid_rows; row++){
- var y = row * cell_height;
- context.moveTo(0,y);
- context.lineTo(a_canvas.width, y);
- }*/
- //劃橫線
- context.moveTo(0,realheight);
- context.lineTo(realwidth,realheight);
- //畫豎線
- context.moveTo(0,20);
- context.lineTo(0,realheight);
- context.lineWidth = 1;
- context.strokeStyle = "black";
- context.stroke();
- var max_v =0;
- for(var i = 0; i<data.length; i++){
- if (data[i] > max_v) { max_v =data[i]};
- }
- max_vmax_v = max_v * 1.1;
- // 將數據換算為坐標
- var points = [];
- for( var i=0; i < data.length; i++){
- var v= data[i];
- var px = cell_width * (i +1);
- var py = realheight - realheight*(v / max_v);
- //alert(py);
- points.push({"x":px,"y":py});
- }
- //繪制坐標圖形
- for(var i in points){
- var p = points[i];
- context.beginPath();
- context.fillStyle="green";
- context.fillRect(p.x,p.y,15,realheight-p.y);
- context.fill();
- }
- //添加文字
- for(var i in points)
- { var p = points[i];
- context.beginPath();
- context.fillStyle="black";
- context.fillText(data[i], p.x + 1, p.y - 15);
- context.fillText(xinforma[i],p.x + 1,realheight+12);
- context.fillText('月份',realwidth,realheight+12);
- context.fillText('資金量',0,10);
- }
- },false);
- })();
- </script>
- </html>
html5生成柱狀圖(條形圖)詳細代碼
運行結果:

以上這篇html5生成柱狀圖(條形圖)效果的實例代碼就是小編分享給大家的全部內容了,希望能給大家一個參考,也希望大家多多支持。
原文地址:http://www.cnblogs.com/shuniuniu/p/5318666.html
小編推薦
熱門推薦